Visualizer 3D Studio3D Analysis: Visualization
All options regarding the visual representation of the scan images can be found in the Visualization Panel of the Right Sidebar as shown in figure 1. By clicking the ![]() button of the sidebar you can toggle the panel accordingly.
button of the sidebar you can toggle the panel accordingly.

The toolbar of the Visualization Panel consists of the following four buttons:
 |
Copy Visualization Push this button to copy the Visualization settings from the current scan image into the clipboard. |
 |
Paste Visualization Push this button to apply the Visualization settings from the clipboard to the current scan image. |
 |
Factory Defaults Push this button to reset the Visualization settings of the current scan image to factory defaults. |
 |
Apply Visualization Push this button to refresh the current scan image by applying all Visualization settings. |
The content of the Visualization Panel is categorized in three groups that will be described in the following subsections.
Elements
-
Axes
Check this option to enable the axes of the scan image, whereas each axis has a different color:- Red = Length of the scan field (impulses)
- Green = Width of the scan field (scan lines)
-
Blue = Depth of the scan field
-
Bounding Box
Check this option to enable the Bounding Box (cubic border) of the scan image.
-
Bookmarks
Check this option to show all active bookmarks within the scan image.
-
Bookmark Size
The slider can be used to decrease (move slider left) or to increase (move slider right) the size of the displayed bookmark icons.
-
Crosshairs Opacity
The slider is used to decrease (move slider left) or to increase (move slider right) the opacity of the crosshairs (3D cursor).
-
Depth-Plane
Check this option to enable the Depth-Plane (blue plane) of the crosshairs.
Scan Image
-
Flat Surface
Check this option to enable an extra scan image plane that is on top of the scan image. Thus you can see the depth information in any perspective view as well as information from the top view at the same time.
-
High Resolution
Check this option to visualize the scan image in a high resolution. Uncheck the option to improve performance of the display instead.
-
Smoothing
Check this option to smooth the graphical data (suppresses hard edges). This option is available for certain render views only, otherwise disabled.
-
Wireframe
Check this option to visualize the scan image as wireframe, otherwise the scan image is displayed in solid mode.
-
Point Size
Removed in 3.3.0
Move the slider to the right to make the actual scan values visible as data points. This can be useful after applying modifiers that generate additional data points (e.g. Subdivision). The slider can be used to decrease (move slider left) or to increase (move slider right) the size of the data points.
-
Line Thickness
Added in 3.3.0
Move the slider to the right to increase the thickness of the lines or to the left to decrease the line thickness. This can be used to influence the display of the grid lines in the 3D Ground Scan or the measurement lines in the Tunnel Scan or Pinpointer.
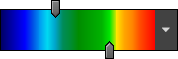 |
Color Schema Choose your prefered color schema from this list to visualize the scan image in different colors. Depending on the selected color schema certain anomalies and details may become visible. Depending on the selected color visibility mode (see below), the sliders can be used to remove certain colors from the current scan image. |
||||||
 |
Color Visibility Mode Added in 3.1.2Select one of the color visibility modes to control how the colors are displayed. Depending on the position of the two sliders of the Color Schema different results will be created.
|
||||||
 |
Increase Anomaly Threshold Push this button to bring more anomalies into view within the scan image. This might be helpful to see also hidden anomalies that are hidden by stronger ones. |
||||||
 |
Reduce Anomaly Threshold Push this button to draw back anomalies from the scan image to focus the core of the large anomalies. |


Texture Opacity
-
Scan Field Overlay
This slider regulates the opacity of the Scan Field Overlay (image of the scan field) to visualize the surface of the actual scan area and to ease the localisation of potential anomalies. Pressing allows to set and change the scan field overlay image.
-
Soil Type Surface
This slider regulates the opacity of the surface texture of the selected Soil Type.
-
Scale
This number can be changed to adapt the scaling of the soil type texture. Normally you just keep this number as it is!
-
Soil Type Cross Section
This slider regulates the opacity of the cross section texture of the selected Soil Type.